

Image Details
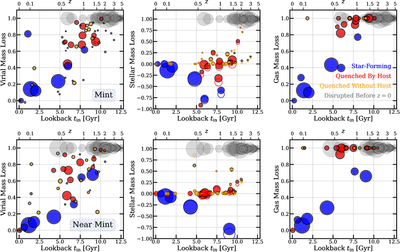
Caption: Figure 7.
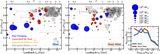
Top left: fraction of virial mass lost since infall as a function of lookback time to infall for Mint satellites. Marker colors and sizes are as in Figure 6, where disrupted satellites have mass-loss fractions of one. Top middle: fraction of stellar mass lost since infall as a function of lookback time to infall for Mint satellites. Fractions of star particles lost since infall (which includes mass loss due to stellar evolution) are indicated in the corresponding open circles. Negative values indicate a growth in stellar mass since infall. Top right: fraction of gas mass lost since infall as a function of lookback time to infall for Mint satellites. Many satellites infell with no gas, and are hence excluded from this panel. Bottom row: similar to the panels in the top row, but for all Near Mint satellites for comparison.
Other Images in This Article
Copyright and Terms & Conditions
© 2025. The Author(s). Published by the American Astronomical Society.

