

Image Details
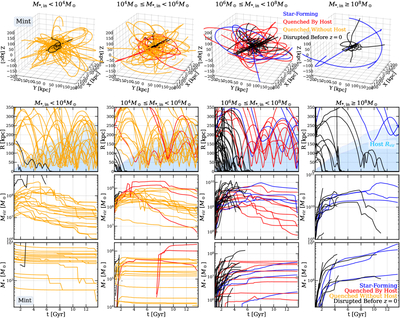
Caption: Figure 5.
Top row: tracking satellite orbital trajectories starting 1 Gyr prior to infall for all satellites from the Mint simulations binned by stellar mass at infall. Orbits are centered on the center of mass of the host (gray dot). Black lines show the orbits of disrupted galaxies as they sink to the center and merge with the host, and solid color lines show surviving galaxies, with line colors corresponding to the convention in Figure 1. Position data for satellites are interpolated across snapshots until disruption (merger with host) for disrupted satellites and z = 0 for surviving satellites. From left to right, each figure corresponds to a different infall stellar mass bin: ultralow (M* < 104 M⊙), low (104 M⊙ ≤ M* < 106 M⊙), intermediate (106 M⊙ ≤ M* < 108 M⊙), and high (M* ≥ 108 M⊙). Second row: tracking the interpolated radial distance from the central host as a function of time for all Mint resolution satellites up until disruption or z = 0. The evolution of the virial radii of the two Mint hosts are indicated in cyan. Third row: the virial mass of each Mint satellite up until disruption or z = 0. Bottom row: the stellar mass of each Mint satellite as a function of time.
Other Images in This Article
Copyright and Terms & Conditions
© 2025. The Author(s). Published by the American Astronomical Society.

