

Image Details
Caption: Figure 1.
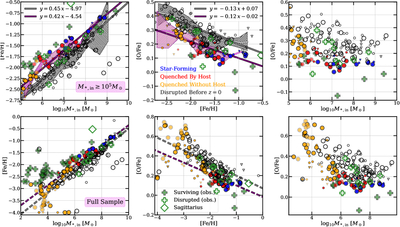
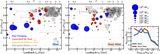
Top: the stellar mass–Z–α relation for simulated satellites in the intermediate- to high-mass range (M*,in ≥ 105 M⊙) where satellites are colored by quenching and survival status. Disrupted satellites are shown in gray open symbols. Surviving star-forming satellites are shown in filled blue symbols, satellites quenched by the host are in red, and satellites quenched >1 Gyr prior to infall are in orange. Surviving galaxies that have fewer than 95% of their infall stars and thus likely to be in the process of tidal disruption are marked by transparent colored markers. Mint resolution satellites, Near Mint Sandra and Elena, and Near Mint Ruth and Sonia satellites are shown in large circles, small circles, and small triangles, respectively. Observed satellites are included in green, where stellar masses from surviving satellites are derived from J. D. Simon (2019) using a mass-to-light ratio of one and MV,⊙ = 4.8, and the [Fe/H] values are also from J. D. Simon (2019). Disrupted satellites (green open pluses) and Sagittarius (green open diamond) are compiled from R. P. Naidu et al. (2022). All [O/Fe] values from the observations are set to the [α/Fe] values from R. P. Naidu et al. (2022). For all surviving and disrupted satellites ≥105 M⊙, we provide the binned medians (light pink and gray lines, respectively), 16th–84th percentile range (pink and gray hatches), and the corresponding least squares fit to the binned medians (dark purple and gray lines). Bottom: similar to the top row, but for our full sample of satellites including observed ultrafaint dwarfs (UFDs). Our simulations appear consistent with the overall M–Z–α trend for satellites around the Milky Way, and successfully reproduce the relatively metal-poor but α-enhanced population of disrupted satellites. The same best-fit lines for satellites ≥105 M⊙ are replotted for comparison.
Other Images in This Article
Copyright and Terms & Conditions
© 2025. The Author(s). Published by the American Astronomical Society.

