

Image Details
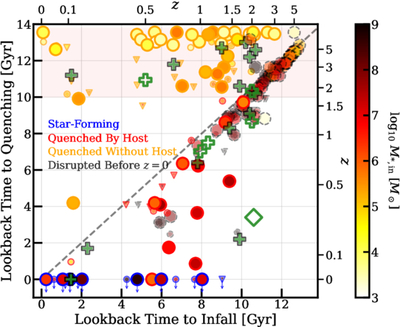
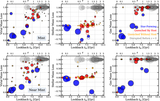
Caption: Figure 4.
Lookback time to infall and quenching for all simulated satellites, colored by their stellar mass at infall. The top shaded region highlights the rough time of reionization. The outlines of the simulated points follow the convention from Figure 1, with disrupted satellites in fainter dashed gray outlines, and surviving star-forming, quenched by host, and quenched >1 Gyr prior to infall satellites are indicated in solid blue, red, and orange outlines, respectively. Both Mint (large circles) and Near Mint (smaller circles and triangles) are included for comparison with the observed patterns in infall and quenching time for Milky Way satellites. Observed satellites, shown as filled green pluses, are from S. P. Fillingham et al. (2019) and disrupted galaxies are from R. P. Naidu et al. (2022). Star-forming satellites are indicated at the bottom of the figure with a lookback tQ = 0 and blue arrows as a lower bound for tQ. The gray dashed line indicates the 1:1 line.
Other Images in This Article
Copyright and Terms & Conditions
© 2025. The Author(s). Published by the American Astronomical Society.

