

Image Details
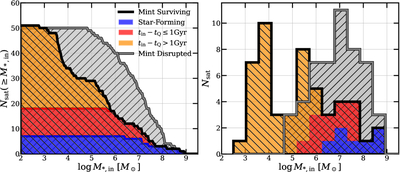
Caption: Figure 2.
Left: CDF of infall stellar masses M*,in of the Mint resolution sample. Using a similar coloring scheme as in Figure 1, the CDF of disrupted satellites is indicated in gray, while the contribution to surviving satellites from star-forming satellites, satellites quenched by the host, and satellites quenched >1 Gyr prior to infall are indicated in blue, red, and orange, respectively. The stacked CDFs of these three categories (indicated by the thick black line) make up the total surviving satellite population. Right: stacked histograms showing the distribution of M*,in between surviving and disrupted satellites. We separate the surviving satellites by quenching status, as in the left panel.
Other Images in This Article
Copyright and Terms & Conditions
© 2025. The Author(s). Published by the American Astronomical Society.

