

Image Details
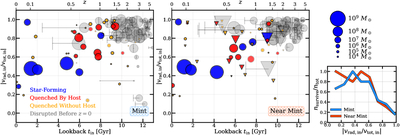
Caption: Figure 6.
Left: the fraction of total velocity in the radial direction at infall, vrad,in/vtot,in, for satellites as a function of their lookback time to infall, for Mint satellites. Point color and styles are as in Figure 3. The size of each point scales logarithmically with the stellar mass of the satellite at infall as shown to the right, with more massive satellites in larger markers. Horizontal lines out to the time of disruption are included for disrupted satellites. Center: similar to the left panel, for Near Mint satellites, where circles are used for satellites of Sandra and Elena, and triangles for Ruth and Sonia. Right: the fraction of total Mint (light blue) and Near Mint (orange) satellites that survive, binned as a function of vrad,in/vtot,in.
Other Images in This Article
Copyright and Terms & Conditions
© 2025. The Author(s). Published by the American Astronomical Society.

