Image Details
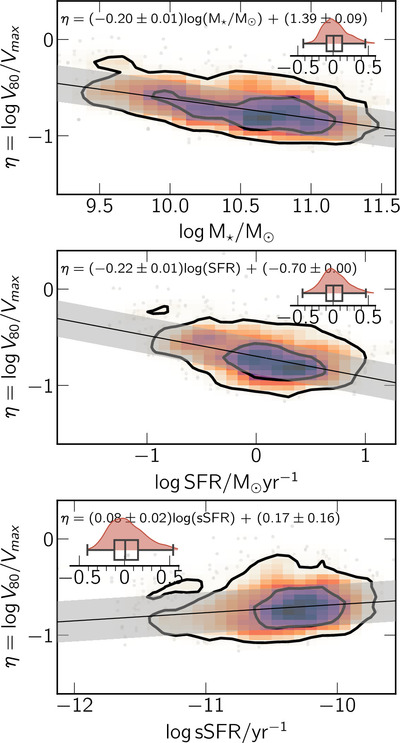
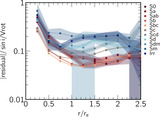
Caption: Figure 9.
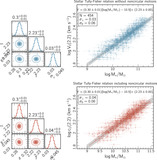
Top panel: two-dimensional histogram showing the distribution of the η parameter vs. the stellar mass for the objects in the kinematic sample. Colors represent the density of points within each bin, with darker colors representing regions with a larger density of objects. The inner and outer contours enclose 68% and 95% of the data, respectively. The black straight line represents the best Bayesian linear fit to these points, with 1σ scatter shown with gray color; the half-violin plot shows the residuals with respect to the best-fit line. Middle and bottom panels: similar as above but for the integrated Hα-based SFR and specific SFR, respectively.
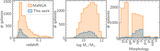
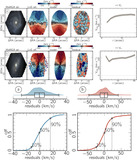
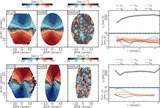
Other Images in This Article
Copyright and Terms & Conditions
© 2024. The Author(s). Published by the American Astronomical Society.