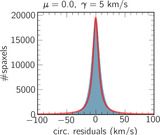
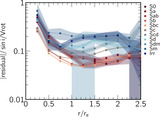
Image Details
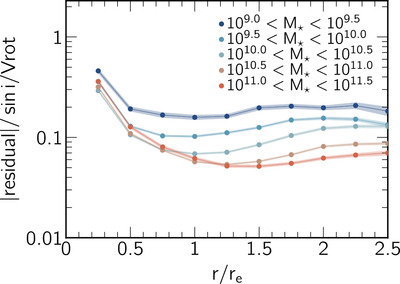
Caption: Figure 7.
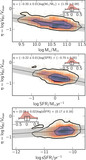
Radial distribution of the circular model residuals (in absolute value) normalized by the rotational curve V t (r) for the 1624 objects in our kinematic sample. Each dot represents the median value of the residuals in 0.25r e bins. Galaxies are segregated into five different mass bins represented by different colors.
Other Images in This Article
Copyright and Terms & Conditions
© 2024. The Author(s). Published by the American Astronomical Society.
Copyright ©
2025 Astronomy Image Explorer. All Rights Reserved.