Image Details
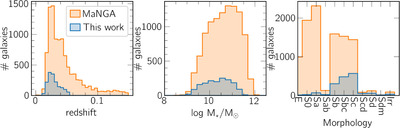
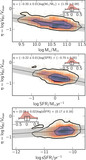
Caption: Figure 1.
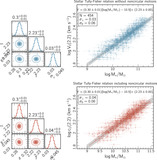
From left to right: distribution of redshift, stellar mass, and morphology of the kinematic sample (blue) compared to the whole MaNGA galaxies (orange). The p-value (≪0.05) from a KS test indicates that our kinematic sample does not represent the entire MaNGA distribution; instead, it is biased toward late-type spirals.
Other Images in This Article
Copyright and Terms & Conditions
© 2024. The Author(s). Published by the American Astronomical Society.
Copyright ©
2025 Astronomy Image Explorer. All Rights Reserved.