Image Details
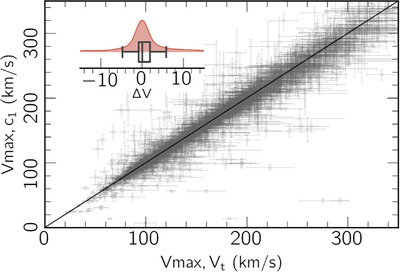
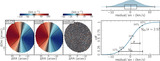
Caption: Figure 5.
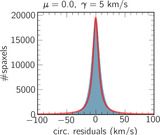
Comparison between maximum rotational velocities estimated from the circular rotation velocities V t (r), and the c 1(r) velocities from the harmonic model. Every point here represents one individual object. The black straight line represents the 1-to-1 line. The inset panel shows a violin plot of the difference between both velocities, i.e., ﹩{\rm{\Delta }}V={V}_{\max ,c1}-{V}_{\max ,t}﹩. The dispersion of the difference is 5 km s−1.
Other Images in This Article
Copyright and Terms & Conditions
© 2024. The Author(s). Published by the American Astronomical Society.
Copyright ©
2025 Astronomy Image Explorer. All Rights Reserved.