Image Details
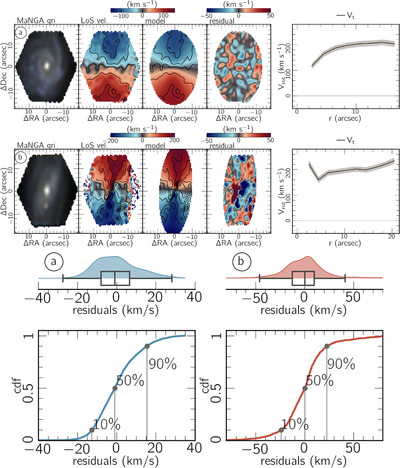
Caption: Figure 2.
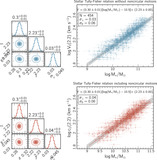
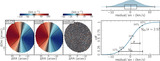
Top figures: modeling of the Hα velocity field adopting circular rotation only for the MaNGA objects 8147-12703 (tagged with the letter “a”), and for 10842-12704 (tagged with “b”). From left to right: gri color composite image with filters extracted from the datacube, Hα velocity map, best circular rotation model from XS, residual map obtained from subtracting the best kinematic model to the Hα velocity, and rotational curve. Bottom figures: half-violin plot and box plot of the residual velocities of objects “a” (blue) and “b” (red); bottom plots show the corresponding cumulative distribution function of residuals, with vertical lines showing the 10th, 50th, and 90th percentiles.
Other Images in This Article
Copyright and Terms & Conditions
© 2024. The Author(s). Published by the American Astronomical Society.