Image Details

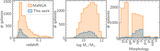
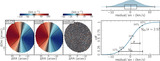
Caption: Figure 6.
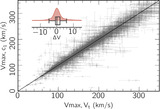
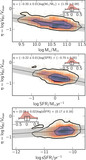
Stellar TFR without including (blue colors) and including (orange colors) NC motions for objects with flat rotational curves in our kinematic sample. The top-left panel shows the marginalized posterior distributions for the slope (s), zero-point (I), and perpendicular scatter (σ ⊥) of the TFR without considering NC motions. Median values and ±1σ dispersion for each parameter are shown at the top of the histograms. The top-right panel shows the stellar TFR with the best-fit parameters and intrinsic dispersion shown in gray color. V max is estimated from V t (r) at 2.2h. The bottom-left and bottom-right panels have similar meanings as above but include NC motions via harmonic decomposition of the LOS velocities. In this case V max is estimated with c 1(r) also at 2.2h.
Other Images in This Article
Copyright and Terms & Conditions
© 2024. The Author(s). Published by the American Astronomical Society.