Image Details

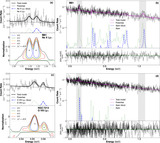
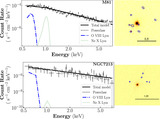
Caption: Figure C1.
Comparison between synthetic hot wind spectral models from numerical simulations in S21 and S22 and observed spectra in the 0.5–2 keV band. The normalization of the models has been accordingly adjusted. The legends are the same as in Figures 1(b) and (d).
Other Images in This Article

Copyright and Terms & Conditions
© 2024. The Author(s). Published by the American Astronomical Society.
Copyright ©
2025 Astronomy Image Explorer. All Rights Reserved.