Image Details
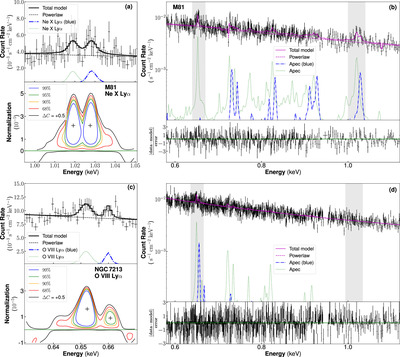
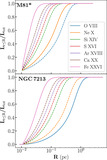
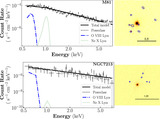
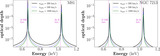
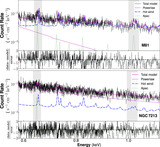
Caption: Figure 1.
(a) and (c): Gaussian fitting (up) and confidence level contours (bottom) of extra prominent blueshifted atomic transition lines (blue dashed–dotted lines) paired with rest-frame counterparts (green dotted lines), Ne X Lyα for M81* and O VIII Lyα for NGC 7213 in the RGS spectra. Black solid and dashed lines describe the total and power-law continuum models. Blue, green, yellow, and red contours correspond to confidence levels of 99%, 95%, 90%, and 68%, respectively, which is derived from the improvement of C-stat for an additional Gaussian line with respect to the baseline continuum model. The photon energy has been calibrated for systematic redshift. (b) and (d): best-fit spectra and the ratio between residues and errors over the 0.6–1.1 keV band for M81* and NGC 7213. The blueshifted components (blue dashed-dot lines) are modeled with single-temperature, single-velocity thermal emission model apec. The additional static thermal components apec are represented in green dotted lines. Gray stripes mark the energy bands where highly ionized O and Ne emission lines reside. Black crosses mark the observed spectral data points with a 1σ error bar. The spectra are optimally binned to ensure a signal-to-noise ratio >3 for illustration purposes.
Other Images in This Article

Copyright and Terms & Conditions
© 2024. The Author(s). Published by the American Astronomical Society.