Image Details
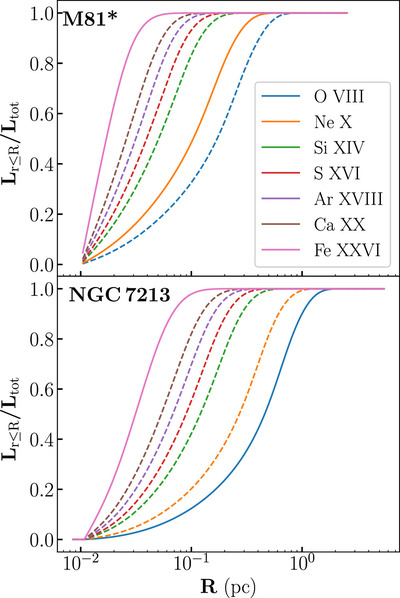
Caption: Figure 2.
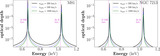
Ratio between the accumulative luminosity within radius R and total luminosity of emission lines produced by hot winds as a function of the distance R to the central black hole for M81* (upper panel) and NGC 7213 (lower panel), predicted by numerical simulations. Highly ionized Fe and O, Ne lines with clear detection in observations are marked in solid lines. Emission lines with elusive detection are marked in dashed lines.
Other Images in This Article

Copyright and Terms & Conditions
© 2024. The Author(s). Published by the American Astronomical Society.
Copyright ©
2025 Astronomy Image Explorer. All Rights Reserved.