Image Details
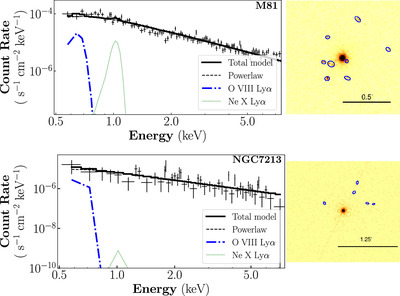
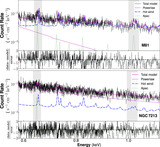
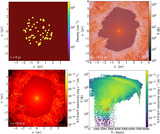
Caption: Figure A1.
Stacked Chandra HETG 0-order image and spectra of off-nucleus contamination point sources in M81* (top panel) and NGC 7213 (bottom panel). Black crosses mark the observed data. Two Gaussian models are placed at putative line centroids, providing 3σ upper limit constraints to O VIII Lyα (blue dashed-dot lines) and Ne X Lyα (green dotted lines) from contamination sources. The luminosity of these contaminated lines is insufficient to account for the blueshifted lines detected in RGS spectra. Solid and dashed black lines describe the total and best-fit power-law continuum models of the stacked off-nucleus spectra. Detected off-nucleus point sources (blue solid circle and ellipses) are marked in the 0.5–8 keV X-ray image.
Other Images in This Article

Copyright and Terms & Conditions
© 2024. The Author(s). Published by the American Astronomical Society.