Image Details
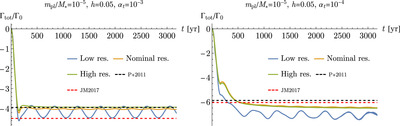
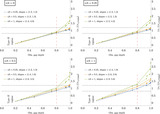
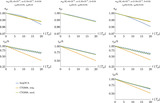
Caption: Figure 9.
Resolution convergence test in two setups with α t = 10−3 (left panel) and α t = 10−4 (right panel); in both panels, m pl/M * = 10−5, and h = 0.05. Continuous colored lines represent the torque output of different 3D simulations with different resolutions as shown in the legend. The torques are rescaled by the torque factor ﹩{{\rm{\Gamma }}}_{0}:= {\left({m}_{\mathrm{pl}}/{M}_{* }\right)}^{2}{\rm{\Sigma }}{r}^{4}{{\rm{\Omega }}}_{{\rm{K}}}^{2}/{h}^{2}﹩. Dashed lines show the prediction from Paardekooper et al. (2011)'s torque prescription (P+2011) and Jiménez & Masset (2017)'s torque prescription (JM2017).
Other Images in This Article
Copyright and Terms & Conditions
© 2024. The Author(s). Published by the American Astronomical Society.