Image Details
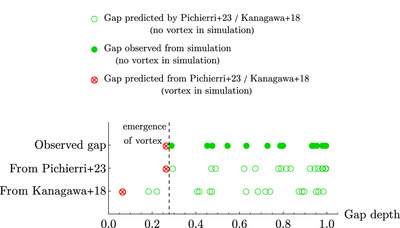
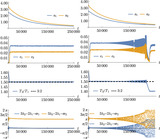
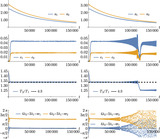
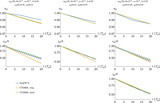
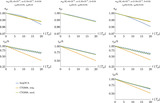
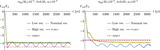
Caption: Figure 1.
Gap depth measured for the set of simulations of Table 1. When no vortex was observed, we mark both the observed gap depth and the predicted one with a green circle (filled and unfilled respectively). Predicted values are obtained with the prescription from Kanagawa et al. (2018) and from our 2D prescription from Pichierri et al. (2023), which, in the low-viscosity case not probed by Kanagawa et al. (2018), gives a better prediction of the gap depth observed also in 3D simulations. In one simulation (for the setup marked with an asterisk in Table 1), we observe a vortex. This case is marked with a red circle with a cross. In this case, we cannot measure a gap depth (because the gap continuously changes); therefore, in the observed gap line, we simply use the value predicted in Pichierri et al. (2023). A dashed vertical line marks the approximate location where the transition between no vortex and vortex lies, which is similar to the one observed in 2D simulations (Pichierri et al. 2023).
Other Images in This Article
Copyright and Terms & Conditions
© 2024. The Author(s). Published by the American Astronomical Society.