Image Details
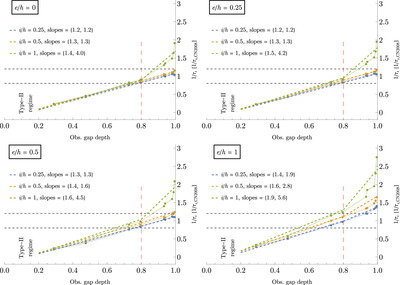
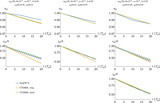
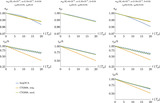
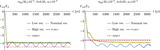
Caption: Figure 4.
Similar to Figure 3, but showing the observed inclination damping efficiency (normalized by the expected value from Cresswell & Nelson 2008) vs. the observed gap depth. Values for the i-damping efficiency are shown for different inclinations i/h ∈ {0.25, 0.5, 1} by points of different colors joined together by opaque lines. The different panels are for different eccentricities, with e/h ∈ {0, 0.25, 0.5, 1}. Two dashed horizontal gray lines indicate, around the expected value in the limit of no gap (to the right in the plots), an error of 20%, which is the typical uncertainty of analytical planet–disk interaction formulas (Paardekooper et al. 2011). In all panels, there is a significant decrease in i-damping efficiency for deeper and deeper gaps, down to a factor of ∼1/5 less efficient damping at the transition from type-I to type-II regimes (gap depths of ≃0.3) as compared to the limit of no gap. The data are well modeled by a double-linear fit that depends on the gap depth, the eccentricity, and the inclination (see Equations (32) and (33)), shown with dashed lines of different colors depending on the orbital inclination.
Other Images in This Article
Copyright and Terms & Conditions
© 2024. The Author(s). Published by the American Astronomical Society.