Image Details
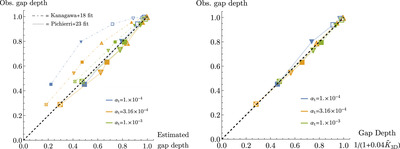
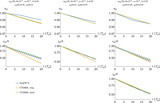
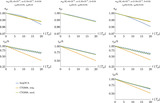
Caption: Figure 2.
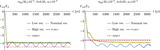
Panel (a): gap depth prediction (either from Kanagawa et al. 2018; or from Pichierri et al. 2023, indicated by small markers linked together by dotted–dashed lines or larger markers linked by continuous lines, respectively) vs. the observed 3D gap depth. Panel (b): New 3D gap depth prediction (Equations (28), (29)) vs. observed 3D gap depth in the limit of circular and noninclined orbits. In all panels, different colors represent different levels of viscosity according to the legend, and symbols of different shapes are used to represent different aspect ratios and planetary masses; squares, downward-pointing triangles, and upward-pointing triangles represent aspect ratios of 0.04, 0.05, and 0.06 respectively; empty, filled and crossed symbols represent m pl/M * = 10−5, 3 × 10⁻⁵, and 6 × 10⁻⁵ respectively.
Other Images in This Article
Copyright and Terms & Conditions
© 2024. The Author(s). Published by the American Astronomical Society.