Image Details
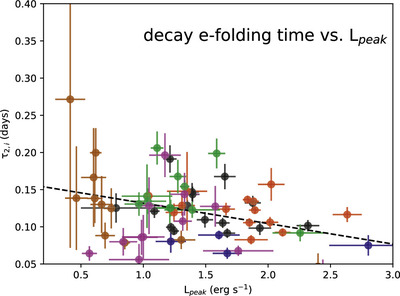
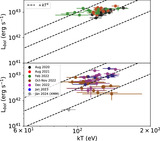
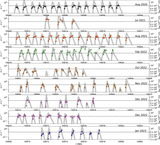
Caption: Figure C2.
Decay e-folding time vs. peak QPE luminosity. There appears to be a slight anticorrelation between L peak and the decay time. The rise times are not plotted, as they are generally poorly constrained due to the sparser sampling; thus, we cannot make strong statements about the presence/lack of a correlation. Where the rise times are constrained, they are typically a factor of ∼2 shorter than the decay times.
Other Images in This Article

Show More
Copyright and Terms & Conditions
© 2024. The Author(s). Published by the American Astronomical Society.
Copyright ©
2025 Astronomy Image Explorer. All Rights Reserved.