Image Details
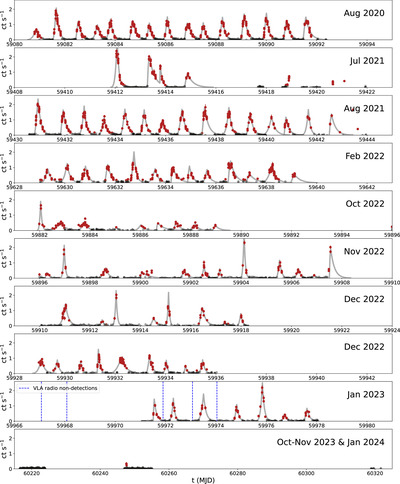
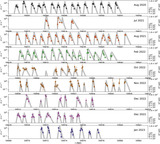
Caption: Figure 1.
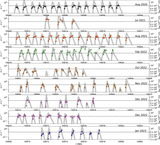
NICER background-subtracted light curves of eRO-QPE1 spanning 3 yr, derived by fitting the source with a blackbody spectral model (tbabs×zbbody) in each 200 s GTI. Red points denote source detections, while black points indicate GTIs in which a blackbody component was not required at >1σ. There are 92 flares, which we fit with the exponential model described in Section 2.2 (gray lines).
Other Images in This Article

Show More
Copyright and Terms & Conditions
© 2024. The Author(s). Published by the American Astronomical Society.
Copyright ©
2025 Astronomy Image Explorer. All Rights Reserved.