Image Details
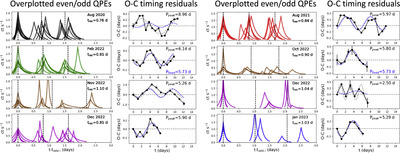
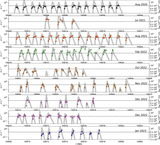
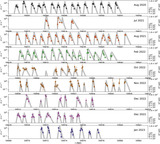
Caption: Figure 7.
Overplotted even/odd burst sequences (demonstrating the high scatter and lack of any long/short recurrence pattern), and the corresponding O–C timing residuals (i.e., whether each burst arrives early/late compared to the average t rec within the epoch, Section 3.3.1). As noted in Arcodia et al. (2022), the scatter in recurrence time (∼50%) is significantly higher than other QPE sources. The O–C plots are overplotted with best-fit periods per epoch (gray dashed line) and overall (blue dashed). The 2020 August epoch (P peak = 8.96 days) and the first 2022 December epoch (P peak = 2.5 days) are significant outliers from the 5.73 average period. The long-short recurrence pattern seen in other QPEs is not generally seen in eRO-QPE1, with the possible exception of a short-lived phase in early 2022 December.
Other Images in This Article

Show More
Copyright and Terms & Conditions
© 2024. The Author(s). Published by the American Astronomical Society.