Image Details
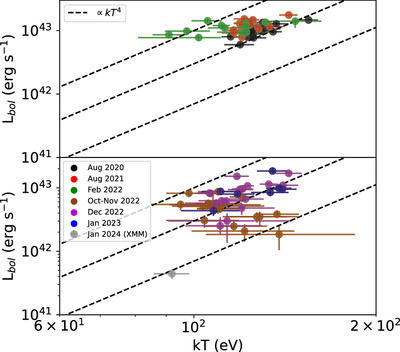
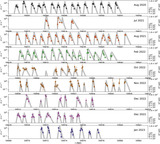
Caption: Figure 4.
Peak L bol vs. kT for each QPE. In general, the trend appears consistent with L bol ∝ T 4, with the exception of the 2022 February and 2022 October–December epochs. The 2022 October–December epochs are also where R bb appears to invert its evolution (Figure 3). The ∝T 4 lines are plotted for visualization only, and are not fits to the data.
Other Images in This Article

Show More
Copyright and Terms & Conditions
© 2024. The Author(s). Published by the American Astronomical Society.
Copyright ©
2025 Astronomy Image Explorer. All Rights Reserved.