Image Details
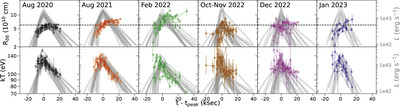
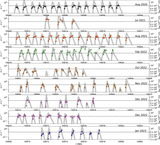
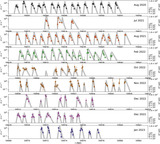
Caption: Figure 3.
Top: inferred blackbody radius R bb (filled points) plotted over fitted double-exponential model luminosity (gray), folded within each epoch. The short-term evolution is consistent with a cooling emission region expanding by a factor of ∼2–3 over each flare, in agreement with Miniutti et al. (2023b). Over the long term, the peak inferred R bb appears to grow (from 2020 August to 2022 February), then shrinks (by 2022 October–November). This may be a geometric (viewing-angle) effect attributed to the EMRI apsidal precession (∼10s of days), or a change in the mutual EMRI-disk inclination due to the EMRI nodal precession (∼100s of days) resulting in changing ejecta properties (see discussion in Section 4.2). Bottom: same plot for kT.
Other Images in This Article

Show More
Copyright and Terms & Conditions
© 2024. The Author(s). Published by the American Astronomical Society.