Image Details
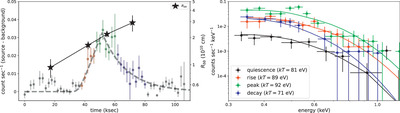
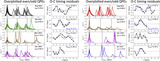
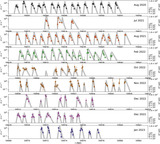
Caption: Figure 2.
Left: light curve showing the QPE observed on 2024 January 5 with XMM-Newton, with the quiescence/rise/peak/decay phases denoted by black/red/green/blue points. Overplotted is the blackbody emitting radius (see Section 3.1). Right: phase-resolved spectra showing quiescence, rise, peak, and decay, along with tbabs×zbbody blackbody fits.
Other Images in This Article

Show More
Copyright and Terms & Conditions
© 2024. The Author(s). Published by the American Astronomical Society.
Copyright ©
2025 Astronomy Image Explorer. All Rights Reserved.