Image Details
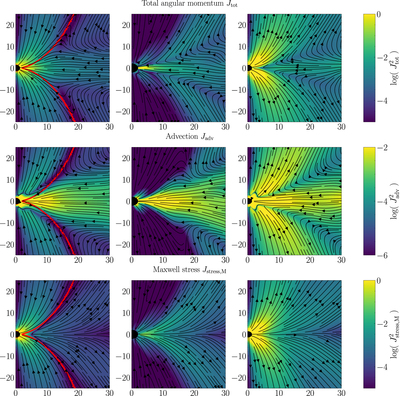
Caption: Figure 16.
Time- and ϕ- averaged maps of the angular momentum flux of the simulations with spin a = −0.94 (left), a = 0 (middle), and a =0.94 (right). The color map represents the modulus of the angular momentum flux, ﹩\sqrt{{({\dot{J}}^{\theta })}^{2}+{({\dot{J}}^{r})}^{2}}﹩. The first row shows the total angular momentum flux, while the second and third rows show the contributions of the advection and Maxwell stress components, respectively. The color-coding for each row is the same to facilitate comparison. For a = − 0.94, we use the red lines to denote the transition radius where the toroidal velocity component u ϕ changes sign. It is seen that its position corresponds to the region in which the radial component of the Maxwell stress changes sign as well.
Other Images in This Article


Show More
Copyright and Terms & Conditions
© 2024. The Author(s). Published by the American Astronomical Society.