Image Details
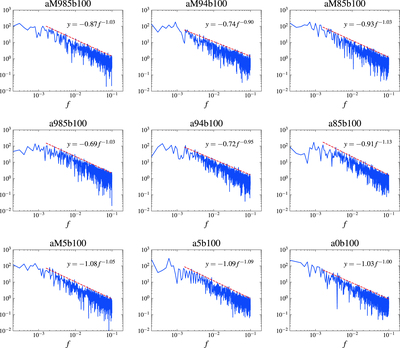
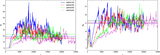
Caption: Figure 6.
Power spectrum of the MAD parameters in the time interval 104 t g < t < 2 × 10⁴ t g (1.5 × 10⁴ t g to 2.5 × 10⁴ t g for aM94b800). In all simulations, the power is concentrated in the low-frequency region, which corresponds to periods about 500–2000t g . In the high-frequency region, the power spectrum decreases following ∼f −1. The dashed red line shows this evolution.
Other Images in This Article


Show More
Copyright and Terms & Conditions
© 2024. The Author(s). Published by the American Astronomical Society.