Image Details
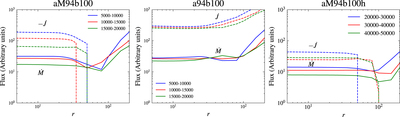
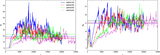
Caption: Figure 1.
The radial profile of the mass accretion rate ﹩\dot{M}﹩ (solid line) and of the angular momentum flux ﹩\dot{J}﹩ (dashed line) for aM94b100 (left panel), a94b100 (middle panel), and for the long-term evolution aM94b100h (right panel) at different time periods (see legend). As the time increases, the steady region extends to a larger radius. This suggests that aM94b100 and a94b100 have established inflow-outflow equilibrium at r < 30r g for 1.5 × 10⁴ t g < t < 2 × 10⁴ t g , while it is about 70r g at 4 × 10⁴ < t g < 5 × 10⁴ for aM94b100h. For the simulations with the negative spin in the left and right panels, the angular momentum fluxes change sign at r = 30–50r g and r = 50–100r g , respectively.
Other Images in This Article


Show More
Copyright and Terms & Conditions
© 2024. The Author(s). Published by the American Astronomical Society.