Image Details
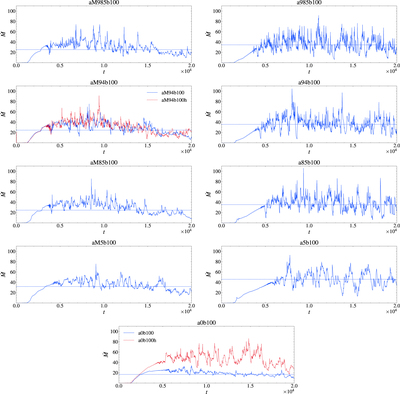
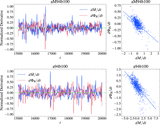
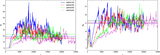
Caption: Figure 2.
Time evolution of the mass accretion rate ﹩\dot{M}﹩. The left column pertains to retrograde disks, while the right columns corresponds to prograde disks. For convenience, we set the y-axes to identical scales to facilitate direct comparison. The horizontal lines are the time-averaged mass accretion rate ﹩\dot{M}﹩, where the averaged is taken from 104 t g to 2 × 10⁴ t g . The last row shows a discrepancy for a = 0 between our low- (a0b100) and high-resolution (a0b100h) simulations. It shows, in this case, that the resolution is too low to resolve the mass accretion rate accurately. However, we found that the MAD parameters are nearly identical, indicating that the properties of the MAD state should be similar. We provide more details on this issue at the end of Section 3.2.
Other Images in This Article


Show More
Copyright and Terms & Conditions
© 2024. The Author(s). Published by the American Astronomical Society.