Image Details
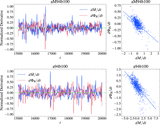
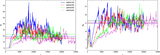
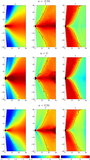
Caption: Figure 4.
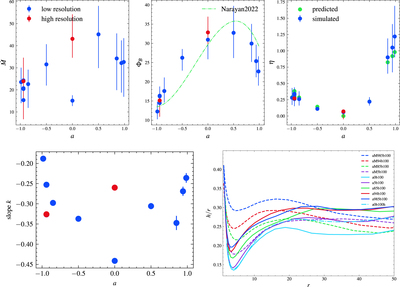
Spin dependence of several disk and jet properties. Top left panel: mass accretion rate ﹩\dot{M}﹩ at the horizon for different spins. The blue points are the results of low-resolution simulations, while the red points are the high-resolution simulations. Top middle panel: normalized MAD parameters for different spins. Plotted on top (dashed green line) are the fit results of Narayan et al. (2022). Their formula is divided by ﹩\sqrt{4\pi }/2﹩ to be consistent with our definition of the MAD parameter (see Section 3.2 for more details). Top right panel: jet efficiency as a function of spin. The green points are the predicted efficiencies, and the blue (red) points are the efficiencies derived from our simulation (red shows the higher resolution). The error bars represent the 1 sigma temporal variation of each quantity. η > 1 represents an efficiency higher than 100%. Bottom left: dependence of the slope ﹩k\equiv (d{{\rm{\Phi }}}_{B}/{dt})/(d\dot{M}/{dt})﹩ on the spin a. The slope k decreases as the spin a increases until a = 0, at which point the slope k begins to increase as a continues to increases. However, a = 0.85 slightly deviates from this trend. Bottom right panel: time-averaged disk height h/r given by Equation (15) as a function of radius.
Other Images in This Article


Show More
Copyright and Terms & Conditions
© 2024. The Author(s). Published by the American Astronomical Society.