Image Details
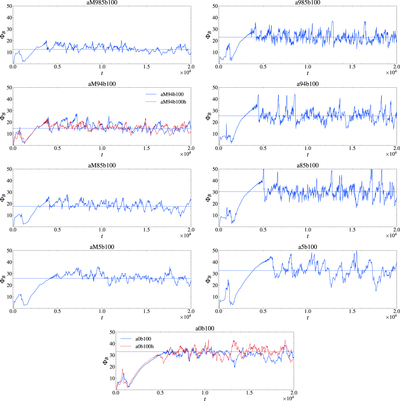
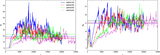
Caption: Figure 3.
The time evolution of MAD parameters Φ B . The left column represents retrograde disks, while the right column is for prograde disks. We use the horizontal lines to denote the time-averaged Φ B from 104 t g to 2 × 10⁴ t g , which is referred to as the typical MAD parameter during the MAD state.
Other Images in This Article


Show More
Copyright and Terms & Conditions
© 2024. The Author(s). Published by the American Astronomical Society.
Copyright ©
2025 Astronomy Image Explorer. All Rights Reserved.