Image Details
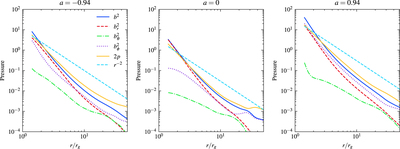
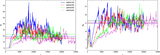
Caption: Figure 12.
The angular- and time-averaged gas pressure p (yellow) and magnetic pressure b 2 (blue) for aM94b100, a0b100, and a94b100. We further show each component of the magnetic pressure, b r 2 (red), ﹩{b}_{\theta }^{2}﹩ (green), and ﹩{b}_{\phi }^{2}﹩ (purple). These values are calculated by Equation (18) and are then time averaged. The dashed (light blue) curve represents the r −2 dependence.
Other Images in This Article


Show More
Copyright and Terms & Conditions
© 2024. The Author(s). Published by the American Astronomical Society.
Copyright ©
2025 Astronomy Image Explorer. All Rights Reserved.