Image Details
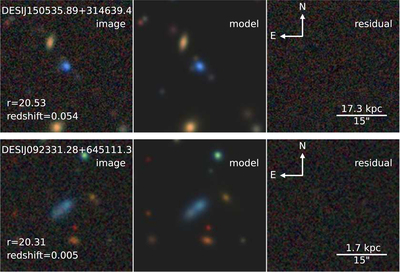
Caption: Figure 8.
The two most metal-poor galaxies identified in this work. The left, middle, and right panels display the observed images, models, and residuals of the detected objects in the DESI Legacy imaging surveys, respectively. The residual is the subtraction of the model from the observed image, where the model is derived by the Tractor photometry code via forward modeling of the galaxy profile (Dey et al. 2019). The Tractor modeling provides the total integrated fluxes for galaxies. The top panels show the images of DESIJ150535.89+314639.4, and the bottom ones present those of DESIJ092331.28+645111.3. The r-band magnitude and redshift are marked in the left panels. The horizontal line denotes the scales in arcsec and kiloparsec at the distance of each galaxy. North is up and east is left.
Other Images in This Article


Show More
Copyright and Terms & Conditions
© 2024. The Author(s). Published by the American Astronomical Society.