Image Details
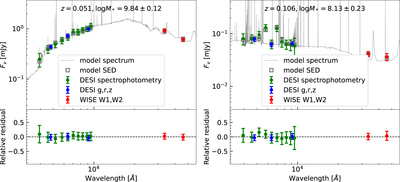
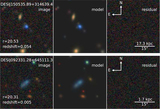
Caption: Figure 5.
Two examples of the CIGALE stellar population synthesis fitting based on the DESI photometric and spectrophotometric data (left for an old quiescent galaxy at z ∼ 0.05 and right for young star-forming galaxies at z ∼ 0.11). The redshift and derived stellar mass for each galaxy are annotated in the top panel. The solid points with error bars represent the observed SEDs. The gray lines are the best-fit model spectra and the gray open squares display the model SEDs. The bottom panel shows the relative residual between observed and model SEDs, which is (F obs − F model)/F obs, where F obs and F model are the observed and model fluxes for a given filter, respectively. The blue points with error bars show the DESI optical photometric fluxes and corresponding errors in the g, r, and z bands, while the red ones display the WISE W1- and W2-band photometry. The green points denote the 10 spectrophotometric fluxes derived by convolving the DESI spectrum with 10 virtual broadband filters and scaled up to correct for aperture effects.
Other Images in This Article


Show More
Copyright and Terms & Conditions
© 2024. The Author(s). Published by the American Astronomical Society.