Image Details
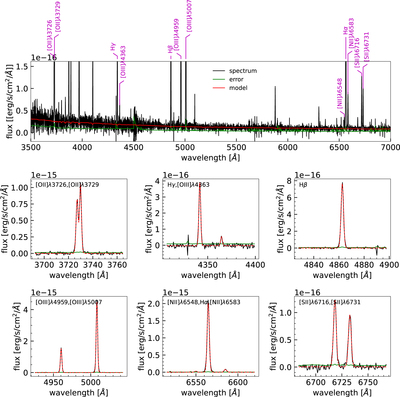
Caption: Figure 2.
Example DESI galaxy spectrum and demonstration of the emission-line flux measurement technique. The top panel shows the spectrum of an arbitrarily selected galaxy at z = 0.29. The black line is the observed spectrum in the rest frame, the green line is the corresponding error spectrum, and the red line is the best-fitted model spectrum. The middle and bottom rows display local parts of the residual spectrum (observed—model) around a specified line or group of lines. Each line is fitted with a Gaussian function, and the grouped lines are fitted with multi-Gaussian functions simultaneously. The red dashed curve in each panel is the best-fitted line profile, which is a combination of the Gaussian function and a linear background.
Other Images in This Article


Show More
Copyright and Terms & Conditions
© 2024. The Author(s). Published by the American Astronomical Society.