Image Details
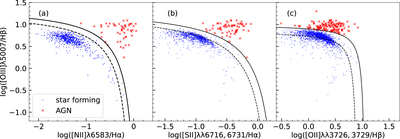
Caption: Figure 3.
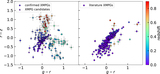
BPT diagnostic diagrams to discriminate star-forming galaxies (blue dots) from AGNs (red crosses). These galaxies shown are [O III]λ4363 detected. (a) The BPT diagram of [O III]λ5007/Hβ vs. [N II]λ6583/Hα. The dashed line shows the empirical division between starbursts and AGNs obtained by Kauffmann et al. (2003). (b) The BPT diagram of [O III]/Hβ vs. [S II]/Hα. The dashed line shows the theoretical division between starbursts and AGNs obtained by Kewley et al. (2001). The solid lines in these two panels display the demarcation curves with an additional uncertainty of 0.1 dex. (c) The galaxy distribution on the plot of [O III]λ5007/Hβ vs. [O II]/Hβ. The dashed line presents the separation limit proposed by Lamareille (2010). The solid line displays the separation limit with the addition of an extra 0.15 dex uncertainty, which is used as our new proposed demarcation between starbursts and AGNs.
Other Images in This Article


Show More
Copyright and Terms & Conditions
© 2024. The Author(s). Published by the American Astronomical Society.