Image Details
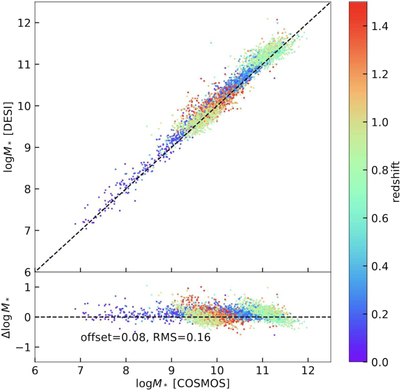
Caption: Figure 6.
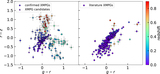
Comparison of the stellar masses from DESI and COSMOS2020. The top panel presents the stellar mass comparison and the diagonal line represents the exact match of the two measurements. The bottom panel shows the mass difference of these two surveys as a function of the stellar mass in the COSMOS2020 catalog. The horizontal line represents ﹩{\rm{\Delta }}\mathrm{log}{M}_{* }=0﹩. The data points are color coded by the DESI spectroscopic redshift. The median difference and scatter of ﹩{\rm{\Delta }}\mathrm{log}{M}_{* }﹩ are also displayed in the bottom panel.
Other Images in This Article


Show More
Copyright and Terms & Conditions
© 2024. The Author(s). Published by the American Astronomical Society.
Copyright ©
2025 Astronomy Image Explorer. All Rights Reserved.