Image Details
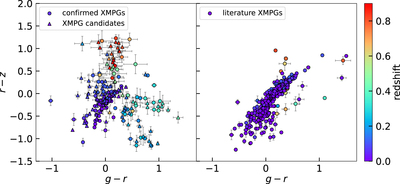
Caption: Figure 10.
Observed color–color diagrams for our DESI XMPGs (left) and the XMPGs collected from the literature (right). The points in each panel are color coded by redshift. The gray error bars show the uncertainties of the colors. In the left panel, the circles represent our confirmed XMPGs, while the triangles represent the XMPG candidates.
Other Images in This Article


Show More
Copyright and Terms & Conditions
© 2024. The Author(s). Published by the American Astronomical Society.
Copyright ©
2025 Astronomy Image Explorer. All Rights Reserved.