Image Details
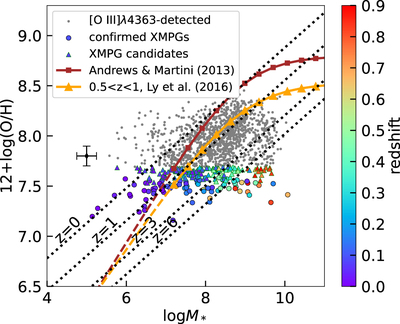
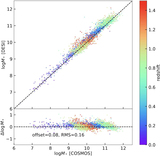
Caption: Figure 13.
Stellar MZR of our XMPGs color coded by redshift. Smaller gray points are the [O III]λ4363-detected galaxies. The point with error bars shows the typical parameter measurement uncertainties. The local MZR from Andrews & Martini (2013) at z ∼ 0.08 is plotted in brown with squares. The MZR at 0.5 < z < 1 of Ly et al. (2016) is plotted in orange with triangles. The dashed extended lines correspond to the extrapolation of these two relations to the low-mass region. The dotted lines show the MZRs of theoretical simulations at z = 0, 1, 3, and 6 from Ma et al. (2016).
Other Images in This Article


Show More
Copyright and Terms & Conditions
© 2024. The Author(s). Published by the American Astronomical Society.
Copyright ©
2025 Astronomy Image Explorer. All Rights Reserved.