Image Details
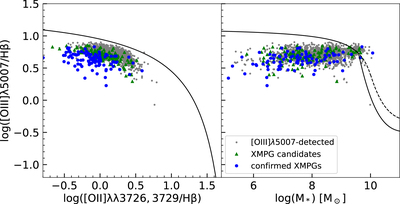
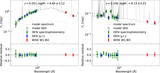
Caption: Figure 11.
Left: BPT diagnostic diagram of [O III]λ5007/Hβ vs. [O II]/Hβ for all [O III]λ4363-detected galaxies (gray), confirmed XMPGs (blue), and XMPG candidates (green). The solid curve is the demarcation line as defined in Equation (3) to separate AGNs from star-forming galaxies. Right: MEx diagram for the same galaxies. The solid and dashed lines are the demarcation curves for starbursts (lower left) and AGNs (upper right), respectively, which come from Juneau et al. (2014).
Other Images in This Article


Show More
Copyright and Terms & Conditions
© 2024. The Author(s). Published by the American Astronomical Society.
Copyright ©
2025 Astronomy Image Explorer. All Rights Reserved.