Image Details
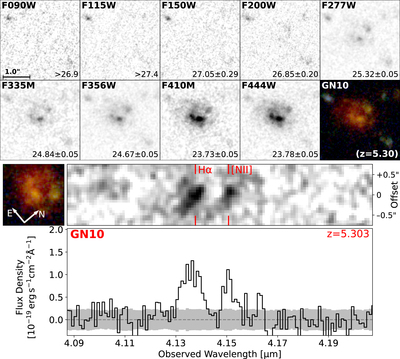
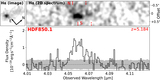
Caption: Figure A2.
Top: NIRCam images of GN10 in the F090W–F444W band. The brightness of GN10 in each band is noted in the lower right corner of each panel (unit: AB mag). Image sizes are 3″ × 3″ (north up, east left). The last panel shows the true-color NIRCam image. Bottom: NIRCam grism spectrum of GN10 (similar to those in Figures 6 and A1). Images are rotated to align with the dispersion direction. Hα and [N II] λ6583 line can be detected at z = 5.303, which are indicated by vertical red lines in 2D spectrum.
Other Images in This Article

Show More
Copyright and Terms & Conditions
© 2024. The Author(s). Published by the American Astronomical Society.
Copyright ©
2025 Astronomy Image Explorer. All Rights Reserved.