Image Details
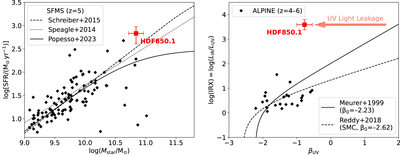
Caption: Figure 7.
Left: star formation rate vs. stellar mass of HDF850.1 (red square), compared with z = 4–6 galaxies observed with the ALMA ALPINE survey (Béthermin et al. 2020; Le Fèvre et al. 2020). The best-fit star-forming main sequences at z = 5 in Speagle et al. (2014), Schreiber et al. (2015), and Popesso et al. (2023) are also plotted for comparison. Right: infrared excess vs. UV continuum slope of HDF850.1, compared with z = 4–6 galaxies in the ALPINE sample whose dust continua are detected with ALMA (Fudamoto et al. 2020). IRX–β UV relations of Meurer et al. (1999), Reddy et al. (2018) are also plotted for comparison. HDF850.1 is well above (or bluer than) these relations because of inhomogeneous dust attenuation and leakage of UV light in the southern component.
Other Images in This Article

Show More
Copyright and Terms & Conditions
© 2024. The Author(s). Published by the American Astronomical Society.