Image Details

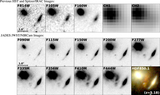
Caption: Figure 2.
JWST NIRCam images after neighbor subtraction and PSF matching. Image sizes are 3″ × 3″ (north up, east left). The FWHM of the matched NIRCam PSF (F444W) is shown in the top right panel. Top left: detection map obtained by stacking the F335M, F356W, F410M, and F444W images. The deblended segments of the HDF850.1-N and -S components are shown in solid red lines. Top center: Rest-frame UV image of HDF850.1 (red, F150W; green, F115W; blue, F090W). The southern component is detected in these images (4σ–9σ). Top right: Rest-frame optical image of HDF850.1 (red, F444W; green, F410M; blue, F356W). The Hα line is within the bandwidths of F410M and F444W filters. The northern component is strongly dust-reddened, and the southern component exhibits bright Hα emission. Bottom left: Hα line map derived from pixelated SED modeling (Section 3.5). The Hα emission from the southern component is higher in terms of surface brightness. Bottom center: Dust-attenuation (A V ) map derived from pixelated SED modeling. The center of HDF850.1 is highly dust-obscured (A V ≳ 5), and the high-A V region matches well with the 1 mm dust continuum emission observed with the PdBI (magenta contours at 4σ and 6σ; Neri et al. 2014). Bottom right: Stellar mass map derived from the A V and observed F356W (i.e., rest-frame V-band) maps. The integrated intensity map of the [C II] 158 μm line is shown as black contours (4σ and 6σ; Neri et al. 2014). The blue and red plus signs mark the centroids of northern and southern [C II] components in Neri et al. (2014), respectively. The beam size of PdBI observation is indicated in the upper right corner.
Other Images in This Article

Show More
Copyright and Terms & Conditions
© 2024. The Author(s). Published by the American Astronomical Society.