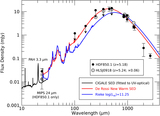
Image Details
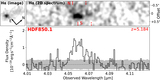
Caption: Figure 5.
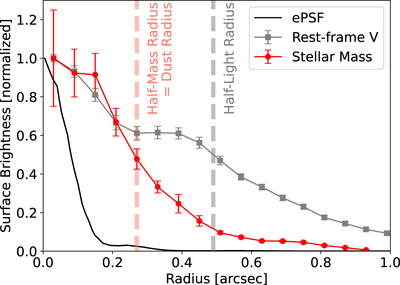
1D profile of HDF850.1 along the direction of major axis in the image plane. Surface brightness profile in the rest-frame V band (F356W) is shown in gray, and stellar mass profile (Section 3.5) is shown in red. Half-light and half-mass radii are highlighted as vertical dashed lines. The half-mass–radius is consistent with the half-light radius of 1 mm dust continuum measured by Neri et al. (2014). Empirical PSF profile in the F444W band is shown in solid black line for comparison. All profiles are normalized to 1 at the centroids.
Other Images in This Article

Show More
Copyright and Terms & Conditions
© 2024. The Author(s). Published by the American Astronomical Society.
Copyright ©
2025 Astronomy Image Explorer. All Rights Reserved.