Image Details
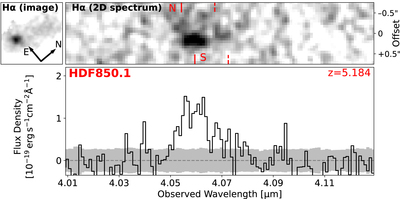
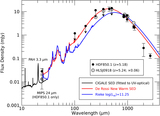
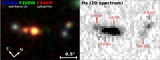
Caption: Figure 6.
NIRCam grism spectrum of HDF850.1 obtained from FRESCO. Top left: same Hα emission-line map as in Figure 2, but rotated to align with the dispersion direction. Top right: 2D grism spectrum of HDF850.1. Hα line emissions from the northern and southern components are indicated with solid vertical red lines, and expected [N II] λ6583 line emissions are indicated by dashed lines. The relative positions of Hα emission from HDF850.1-N and S are different from those in the top left panel, suggesting different velocities of the two components. Bottom: 1D spectrum of HDF850.1 obtained by collapsing the 2D spectrum within ±0.″5 spatial offset. The uncertainty spectrum is shown as the filled gray region. The full 1D spectrum is displayed in Appendix, Figure A3.
Other Images in This Article

Show More
Copyright and Terms & Conditions
© 2024. The Author(s). Published by the American Astronomical Society.