Image Details
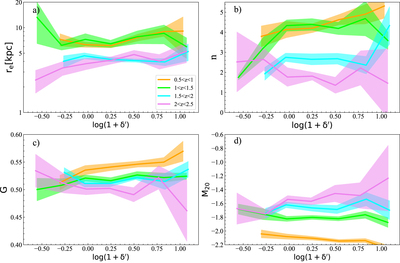
Caption: Figure 6.
Galaxy structure parameters, (a) r e, (b) n, (c) G, and (d) M 20, as functions of the overdensity at redshift 0.5 < z < 2.5. In each panel, the orange, lime, aqua, and violet lines represent the median values in different redshift bins, while the corresponding shaded areas indicate the 1σ uncertainties of the medians over each overdensity bin estimated via the bootstrapping method.
Other Images in This Article
Copyright and Terms & Conditions
© 2023. The Author(s). Published by the American Astronomical Society.
Copyright ©
2025 Astronomy Image Explorer. All Rights Reserved.