Image Details
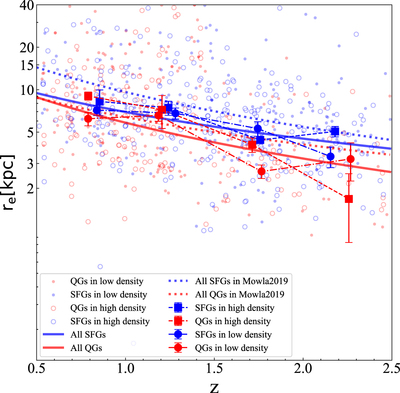
Caption: Figure 5.
Sizes of the most massive galaxies as a function of redshift for SFGs and QGs. The blue (red) dots and open circles represent individual SFGs (QGs) in the lowest- and highest-overdensity quarters, respectively. The blue (red) solid line represents the best-fit size evolution of all SFGs (QGs) in our sample. For SFGs (QGs) in the lowest- and highest-overdensity quarters, we denote their median sizes in each redshift bin as blue (red) solid circles and squares with error bars, respectively. The error bars are estimated by the bootstrapping method with 1000 resamplings. The results from Mowla et al. (2019) are also shown with blue and red dashed lines for SFGs and QGs, respectively.
Other Images in This Article
Copyright and Terms & Conditions
© 2023. The Author(s). Published by the American Astronomical Society.