Image Details
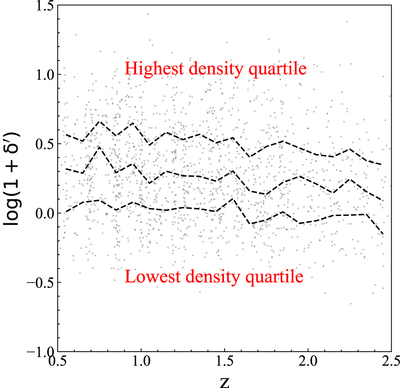
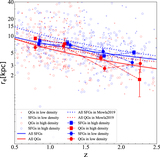
Caption: Figure 4.
The overdensity (﹩1+\delta ^{\prime} ﹩) distribution as a function of redshift. The gray dots represent individual galaxies in our sample, while the black dashed curves indicate the 25%, 50%, and 75% percentiles of the binned distributions within a small redshift interval (Δz = 0.1).
Other Images in This Article
Copyright and Terms & Conditions
© 2023. The Author(s). Published by the American Astronomical Society.
Copyright ©
2025 Astronomy Image Explorer. All Rights Reserved.