Image Details
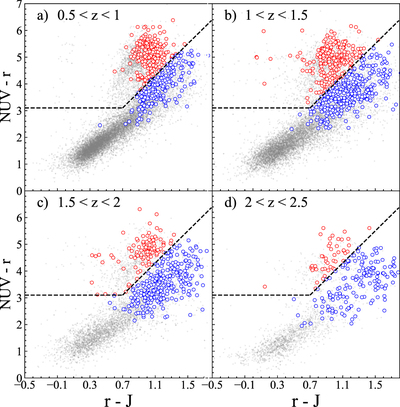
Caption: Figure 1.
Rest-frame NUV − r vs. r − J color distribution in four redshift bins. QGs and SFGs are separated by the selection criteria defined in Equations (2) and (3), shown by the black dashed lines. All the galaxies in the COSMOS-DASH field with ﹩\mathrm{log}({M}_{\star }/{M}_{\odot })\gt 10﹩ in each redshift bin are shown in gray. SFGs and QGs in our sample with ﹩\mathrm{log}({M}_{\star }/{M}_{\odot })\gt 11﹩ are indicated by blue and red open circles, respectively.
Other Images in This Article
Copyright and Terms & Conditions
© 2023. The Author(s). Published by the American Astronomical Society.
Copyright ©
2025 Astronomy Image Explorer. All Rights Reserved.